Please activate JavaScript!
Please install Adobe Flash Player, click here for download
ePaper created 2014-05-14, 15:14:44 | version 1.30.01
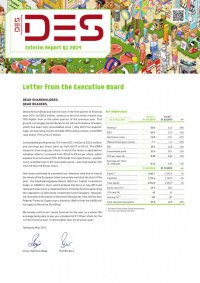
Interim Report Q1 2014 DEAR SHAREHOLDERS, DEAR READERS, Deutsche EuroShop was well on track in the first quarter of financial year 2014. At €50.0 million, revenue in the first three months was 18% higher than in the same quarter of the previous year. This growth can largely be attributed to the Altmarkt-Galerie Dresden, which has been fully consolidated since 1 May 2013 Correspond- ingly, net operating income climbed 18% to €45.6 million, while EBIT rose nearly 19% to €44.2 million. Consolidated profit grew by 12% from €20.1 million to €22.6 million, and earnings per share were up from €0.37 to €0.42. The EPRA measure of earnings per share, in which the result is adjusted for valuation effects, increased from €0.40 to €0.44 per share, which equates to an increase of 10%. FFO (funds from operations) – another much-watched ratio in the real estate world – also improved by 10% from €0.50 to €0.55 per share. One issue continued to command our attention (and that of nearly the whole of the European listed real estate world) at the start of the year: the Kapitalanlagegesetzbuch (German Capital Investment Code), or KAGB for short, which entered into force in July 2013 and represents Germany’s implementation of the EU directive governing the regulation of alternative investment fund managers. However, we received confirmation at the end of the quarter from the German Federal Financial Supervisory Authority (BaFin) that the KAGB will not apply to Deutsche EuroShop. We hereby confirm our recent forecast for the year as a whole. We envisage being able to pay you a dividend of €1.30 per share for the current financial year, 5 cents higher than the previous year. Hamburg, May 2014 Claus-Matthias Böge Olaf Borkers KEY GROUP DATA 01.01. – 31.03.2014 01.01. – 31.03.2013 +/- Revenue 50.0 42.4 18% EBIT 44.2 37.3 19% Net finance costs -13.8 -10.1 -37% Measurement gains / losses -1.1 -1.4 -25% EBT 29.3 25.8 14% Consolidated profit 22.6 20.1 12% FFO per share (€) 0.55 0.50 10% Earnings per share (€, undiluted) 0.42 0.37 14% 31.03.2014 31.12.2013 +/- Equity ** 1,662.1 1,642.4 1% Liabilities 1,712.4 1,752.5 -2% Total assets 3,374.5 3,394.9 -1% Equity ratio (%) ** 49.3 48.4 LTV-ratio (%) 42 43 Gearing (%) ** 103 107 Cash and cash equivalents 59.0 40.8 45% * European Public Real Estate Association ** incl. non controlling interests IN € MILLION Letter from the Executive Board